About hydrography
Gaining insight into the complexity of the dark depths
Seawater has a complex composition and consists of 96,5% liquid water and a group of solutes like chloride and sodium, which gives seawater it’s typically salty taste. Next to these major constitutes, nutrients (e.g., nitrogen), gases (e.g., oxygen), trace elements (e.g., lead) and organic compounds (e.g., lipids) can be found in seawater. Hydrographers can study the composition of a water sample at a certain depth by taking a water sample through a “niskin” bottle, attached to the CTD. A CTD can measure the salinity by measuring the electrical conductivity of the water sample. And what seems to be an uniform mass of liquid water, actually holds changing patterns that triggers hydrographers to gain insight into the complexity of the dark depths.
Salinity and temperature drive deep sea ocean circulation
During a beach trip, it is easy to notice the surface of the sea getting rougher during windy days, which makes it harder to swim in stronger currents. These strong surface currents are actually a glimpse of what happens on a global scale in terms of ocean circulation – what is known as the great conveyor belt. Driven by changes in temperature and salinity, a deep-ocean circulation moves water around the globe and brings warm water from the Gulf of Mexico to the Norwegian sea to temper the climate of northwest Europe. To know how differences in salinity and temperature fuel this deep see ocean circulation belt, we need to understand how these variations occur.
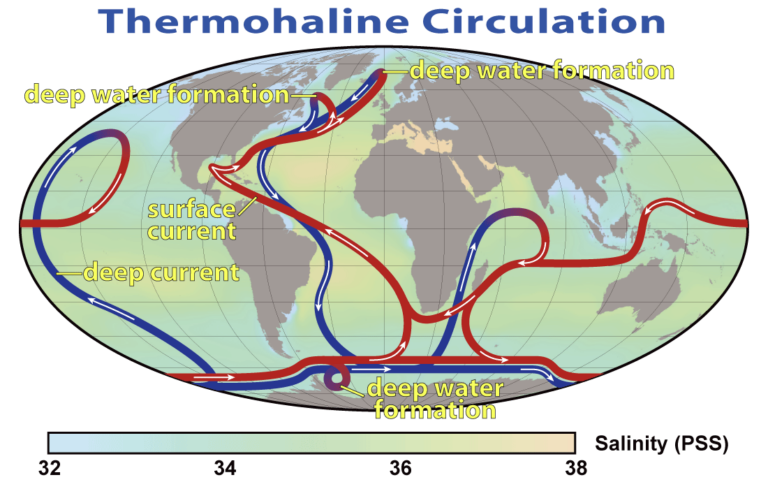
As our globe has a sphere-shaped body, we observe a smaller amount of insolation (lower amount of solar radiation from the sun) reaching the ocean surface at the poles, and a higher amount at the equator. Temperatures within the same range are connected through isotherms, a term commonly used in our daily forecasts. These variations in temperature differ regionally and seasonally as the earth tilts. A vertical temperature profile has been observed by hydrographers. Underneath the surface water layer heated by the sun, a steep gradient in temperature change drops towards a colder layer underneath, called the thermocline. A similar pattern can be observed in ocean salinity, with a steep gradient in salinity: a halocline. A lower amount of salinity can be observed at the poles and the equator due to rain and higher amount in the subtropics. These variations in salinity and temperature make cold and dense water at the poles sink, contributing to the global conveyor belt: this process is called the thermohaline circulation. Due to the movement of ocean water, freezing cold water originating from the poles can be found in the deep layers of water at the equator.
These varying patterns in temperature/salinity -measured with a CTD- excite hydrographers to study how the latter vary over time and place. During hydrographic cruises, bathymetric surveys are also conducted to measure the terrain, using multibeam echo sounders.
References:
EuroGO-SHIP proposal
Invitation To Oceanography ,ed. :6 Paperback – by Paul R. Pinet