Following are two examples of real-time CTD collection from the Southern Ocean south of South Africa (in the global model domain), and the north-east Atlantic (in the AMM15, European Northwest Shelf, domain). Both areas are poorly observed with respect to in-situ temperature and salinity profiles.
Example One: Sir David Attenborough cruise in the Weddell Sea, Southern Ocean:
During a research cruise on the Sir David Attenborough in February 2024, 93 temperature and salinity profiles were observed by the CTD instrument. The measurements were made on the continental shelf to the east side of the Antarctic Peninsula, and an east-to-west section was measured from the deep Weddell Sea back towards the shelf, following latitude 64.5 S. The data from this cruise creates a very clear example of the impact of real-time CTD profiles on the global ocean model, as there were very few other in-situ observations in this region at this time.
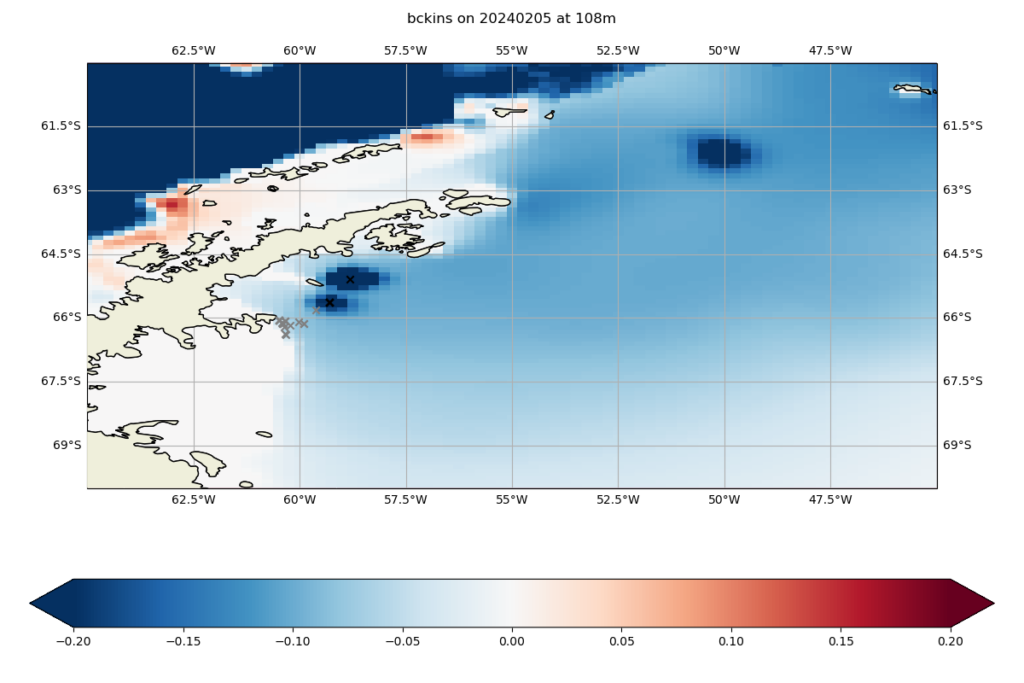
These CTD profiles were made available for assimilation in real-time with fast latency (mean delay of 2.3 hours). This allowed us to see how the observations influenced the ocean forecast model in the Met Office’s global coupled ocean-atmosphere system. When assimilating observations, the ocean model will retain the corrections made to it over some time and propagate it through the model’s representation of physical processes. Observation data is also spread over horizontal and vertical distance – e.g. around 50 to 100 km horizontally. The change in the surface ocean conditions within the ocean model will influence the bottom layer of the atmospheric forecast, altering the air-sea flux of heat and moisture. We can see impacts in both shallow continental shelf locations and in the GO-SHIP-like transect sampling pattern. Figure 1 shows the ‘increments’, or corrections, made to the model due to the influence of the assimilated CTD observations. The CTD observations nudged the model 1 °C warmer and 0.2 psu fresher on the shelf at 65 S, 59 W on 5th February over a region of about 1 degree (100 km) diameter. In the CTD section, the area of influence is larger. The CTD observations nudge the model about 1 °C cooler and 0.2 psu fresher, over an area of about 2 degrees (200 km) centred on 64.5 S, 53 W on 13th February. See the progress of the research cruise through the coupled ocean model space via animations of temperature increments at depth level 108 m. The increment colour scale is from -1.0 to + 1.0 degrees C, from 1st to 19th February.
Figure 1: Plots showing coupled model ocean salinity increments and the location of CTD observations during the Sir David Attenborough cruise to the Weddell Sea in February 2024. Black crosses show the location of CTDs assimilated into that day’s coupled ocean-atmosphere forecast run, grey crosses show the locations of previous days’ CTDs. The colour scale shows the increments (changes made to the model in response to assimilation of the observations, ranging from -0.2 to +0.2 psu) for salinity. Assimilation impacts are shown for the continental shelf (left) and the deep ocean CTD section (right). Both plots show model depth level of 108 m.
Example Two: James Cook cruise to PAP mooring, JC247, May 2023, NE Atlantic:
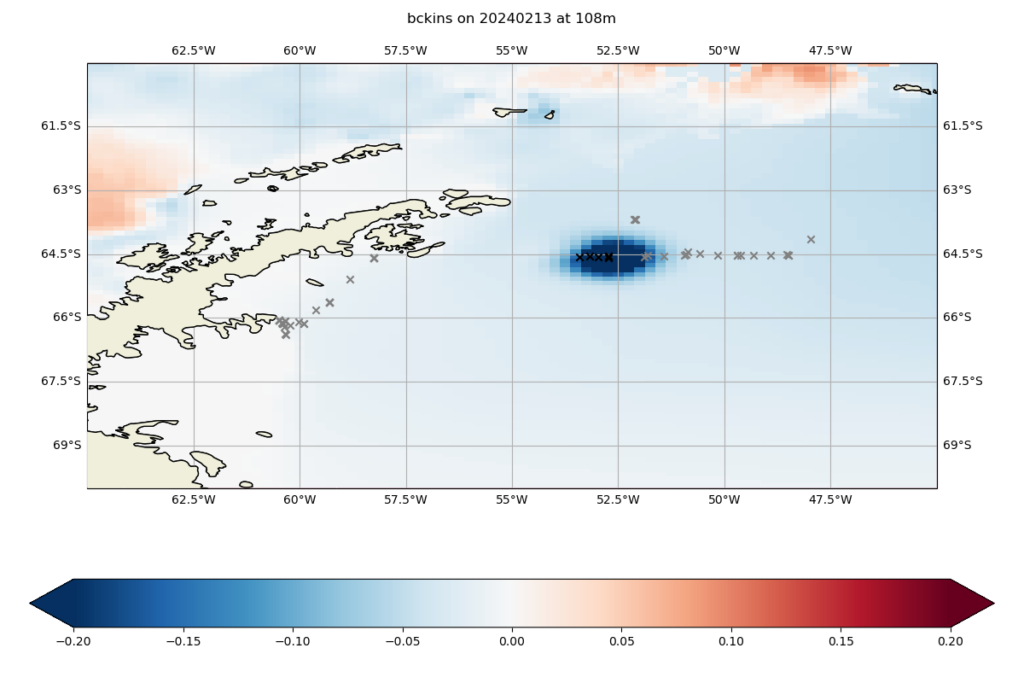
Twelve CTDs were observed around the Porcupine Abyssal Plain mooring at 49N, 16.5W. These were made available for assimilation in real-time, giving a chance to see how repeated CTDs in the same location can influence the ocean forecast model in the AMM15 (European NW Shelf) system. Figure 2 shows temperature profiles to 5,000 m depth. By the end of the study period (18th May), the model temperature (blue) is closer to the observations (green), most noticeably near the seabed. Thinking about the horizontal influence of the CTD observations, figure 3 shows the increments extending to a circle of a diameter of about 1 degree (100 km). For temperature, the assimilation of the observations has nudged the model approximately 1 °C warmer, and for salinity they have pushed the model around 0.1 psu saltier.
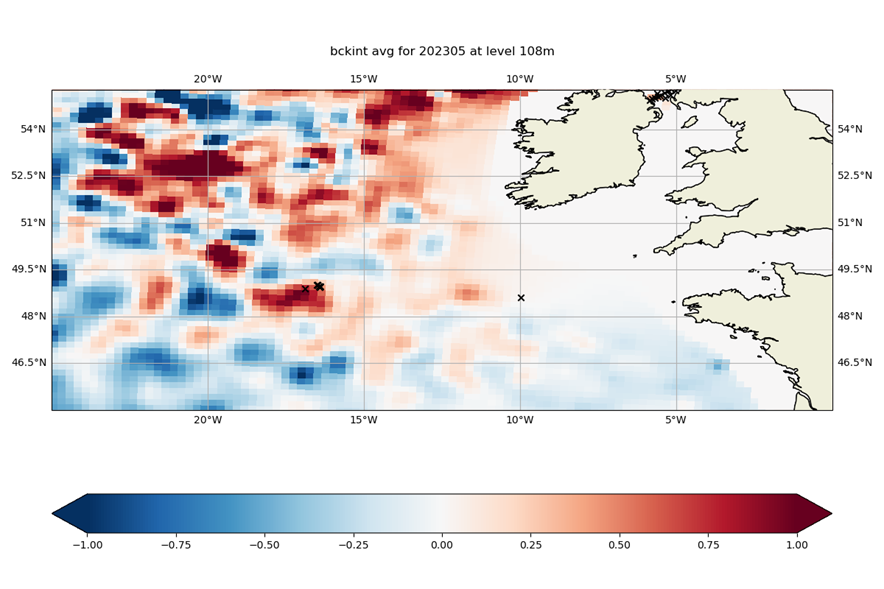
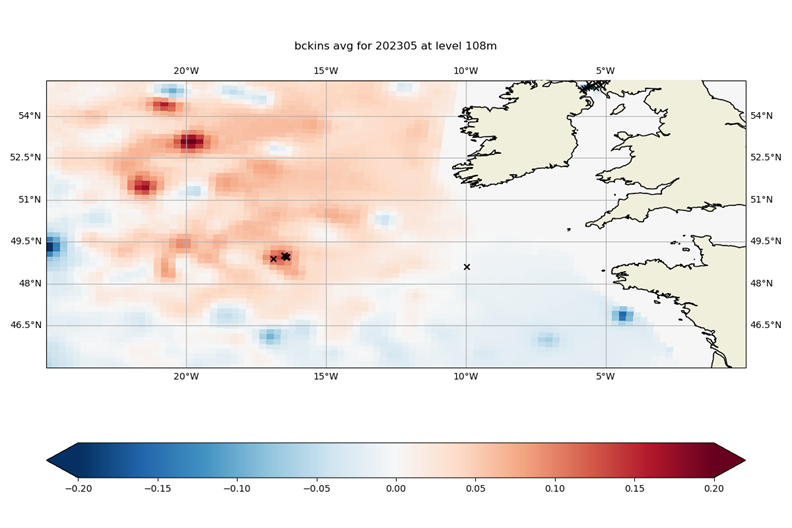
Figure 3: Plots showing the location of CTD observations at the Porcupine Abyssal Plain (PAP) mooring during cruise JC247 in May 2023 (black crosses). The colour scale shows average increments (changes made to the model in response to assimilation of the observations) for temperature (left, ranging from -1.0 to +1.0 degrees C) and salinity (right, ranging from -0.2 to +0.2 psu) at 108 metres depth.